
Browse the Report

1. Executive summary

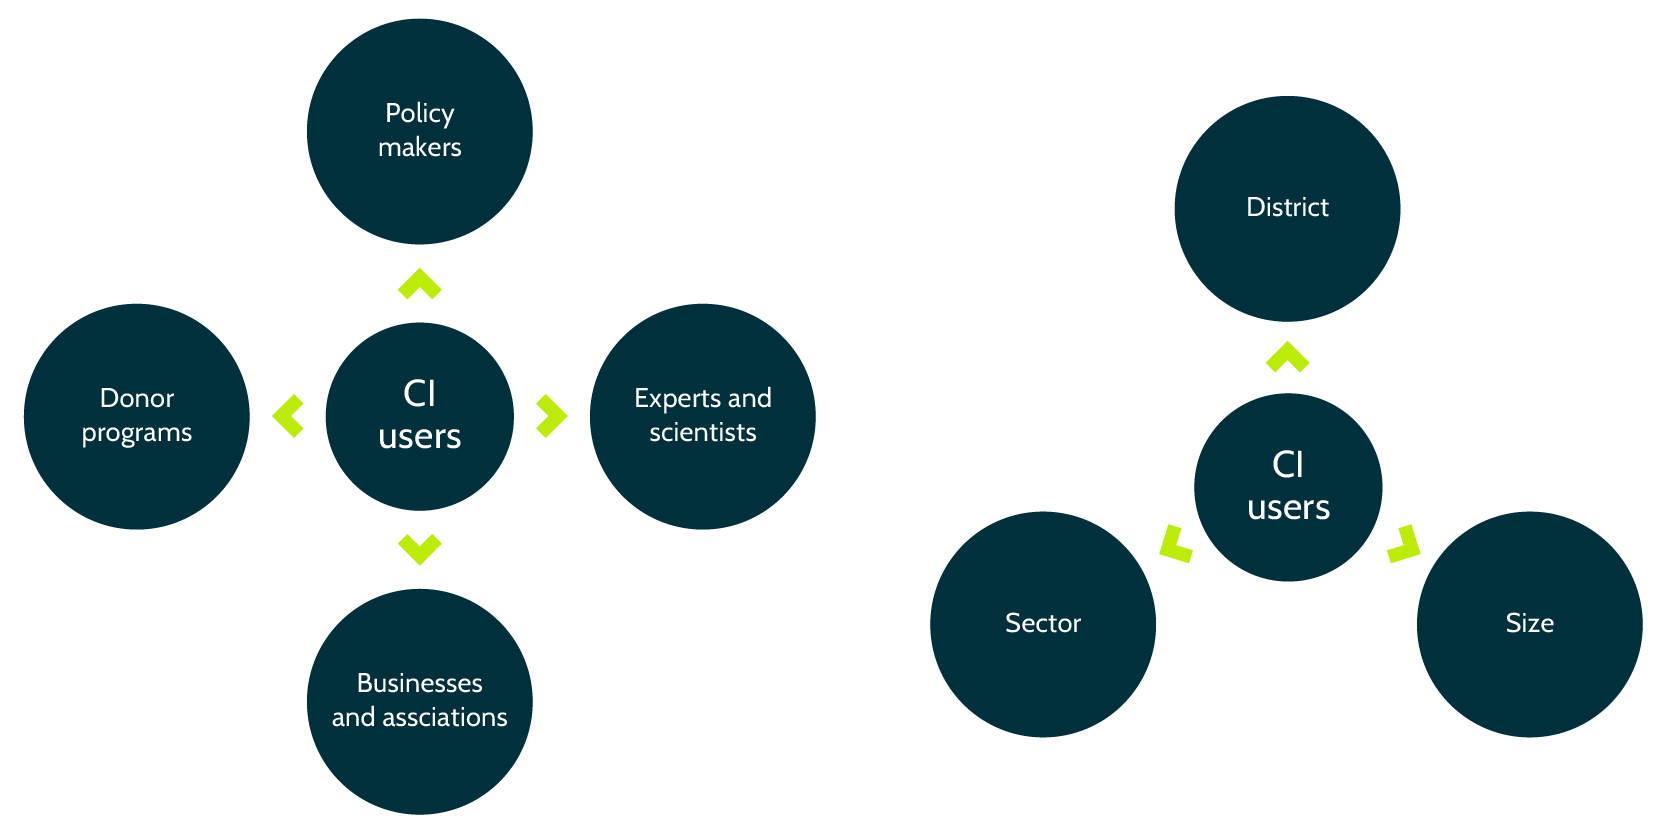
The SME Compass Index (CI) is a composite index that aims to assess the overall competitiveness of the Serbian SME sector. Composite indices are widely recognized as useful tools for analyzing public policies and communicating with the public. They provide a way to summarize complex topics and trends across different fields, making them easier to interpret and compare. The CI combines 75 indicators across 11 sectors, various company sizes, and 25 administrative districts of Serbia. It serves as a comprehensive measure of competitiveness and innovation in the Serbian economy, addressing the shortcomings of previous indices. The index consists of nine pillars, including business sentiment and performance, business environment, human resources, business model, digitalization and industry 4.0, innovation, green transformation, access to finance, and gender equality.

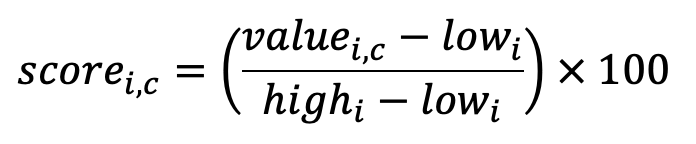
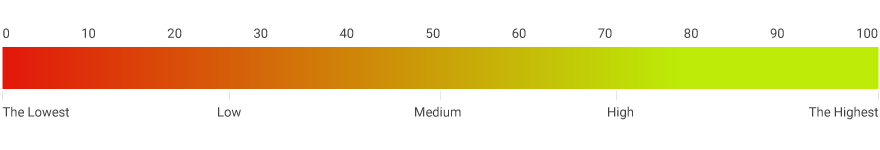
The CI offers valuable insights into the areas where Serbian SMEs are excelling or lagging global trends. This information can guide policymakers, development projects, initiatives, and the monitoring of national strategic documents. The index is accessible through an interactive web portal, providing convenient access to all the necessary information in one place. While composite indices offer advantages such as summarizing multidimensional influences and facilitating communication, their construction and interpretation require transparency to avoid misleading conclusions. Additionally, the choice of indicators and weights can be subjective and contentious. Nevertheless, the CI serves as a valuable tool for initiating discussions, stimulating public interest, and supporting evidence-based decision-making in the Serbian SME sector. All CI indicator scores are standardized between 0 and 100.
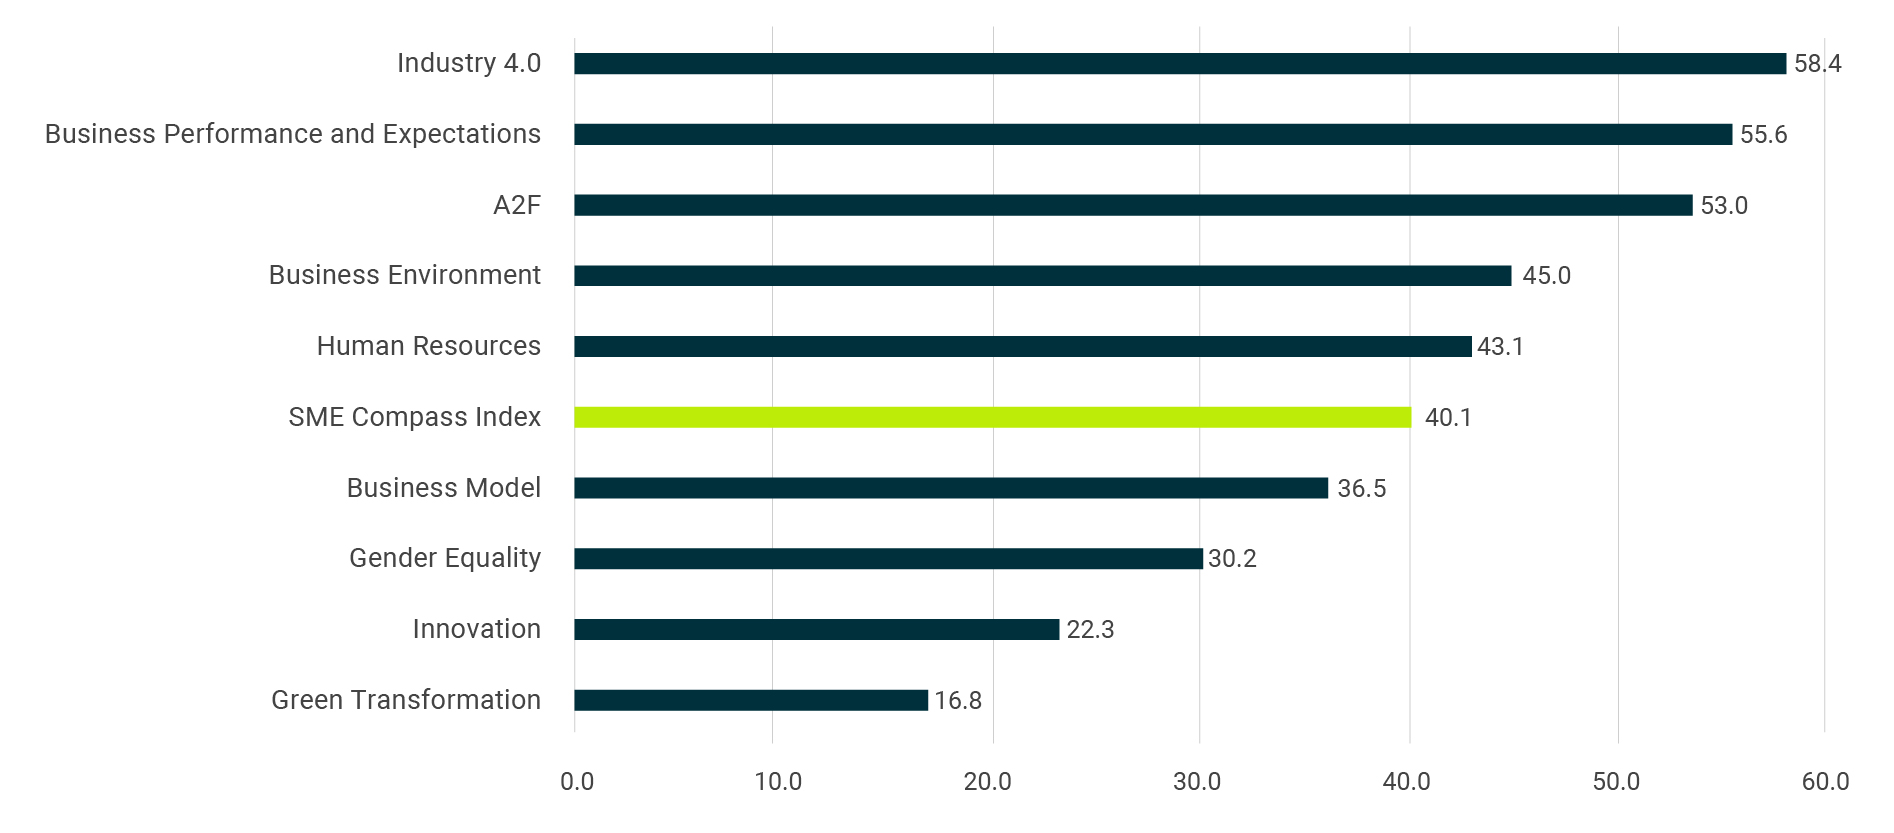
The CI for Serbia in 2023 stands at 40.1 out of 100, indicating a mid-low level of competitiveness and development in the private sector. Serbian SMEs excel in sentiment and performance, driven by overwhelmingly positive sentiments and long-term optimism. However, there are weaknesses in the areas of business model and human resources. Although workers in Serbia are praised for their quality, the labor shortage poses a significant constraint. While companies demonstrate export orientation, they make limited efforts to improve management and production, hindering innovation, green transformation, digitalization, and industry 4.0, resulting in poor CI scores in these areas.

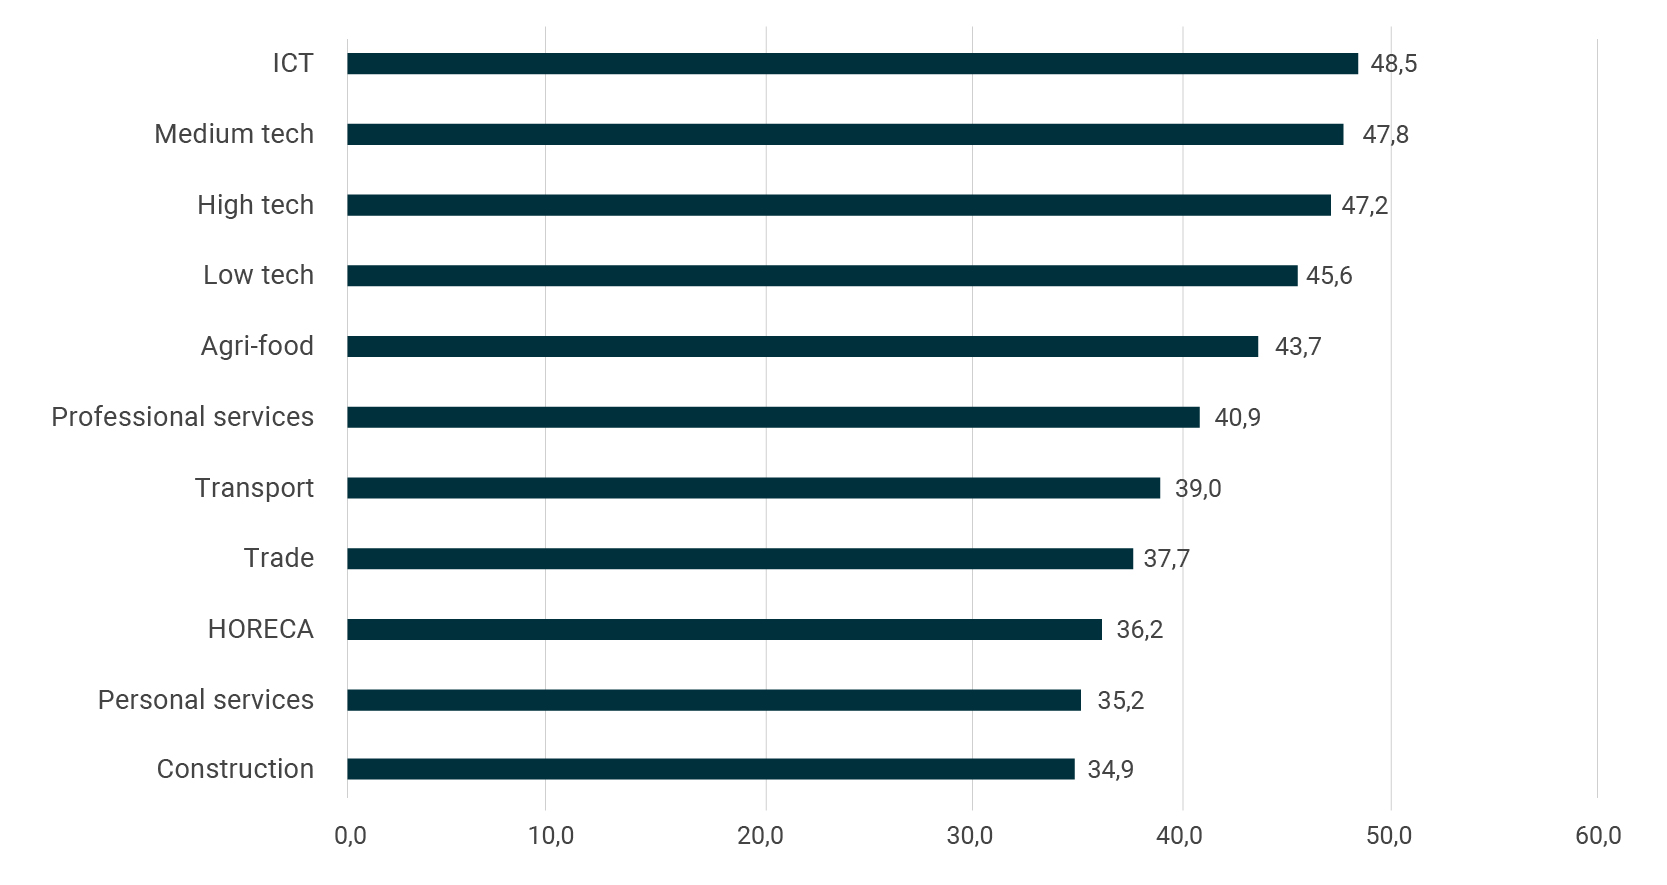
Among different sectors, higher value-added sectors outperform lower value-added ones. The top three most competitive sectors in Serbia are ICT, high-tech manufacturing, and mid-tech manufacturing. These sectors lead in economic performance, sentiment, business model development, and application of modern technologies and innovation. ICT and high-tech manufacturing are less constrained by the labor shortage and exhibit greater gender equity. Medium-tech manufacturing excels in business model development and green transformation. Sectors at the bottom face similar challenges but significantly lag behind in business model, digitalization, innovation, and green transformation.

Key takeaways from the CI analysis include:

  • Positive economic sentiment is present in spite of global challenges.
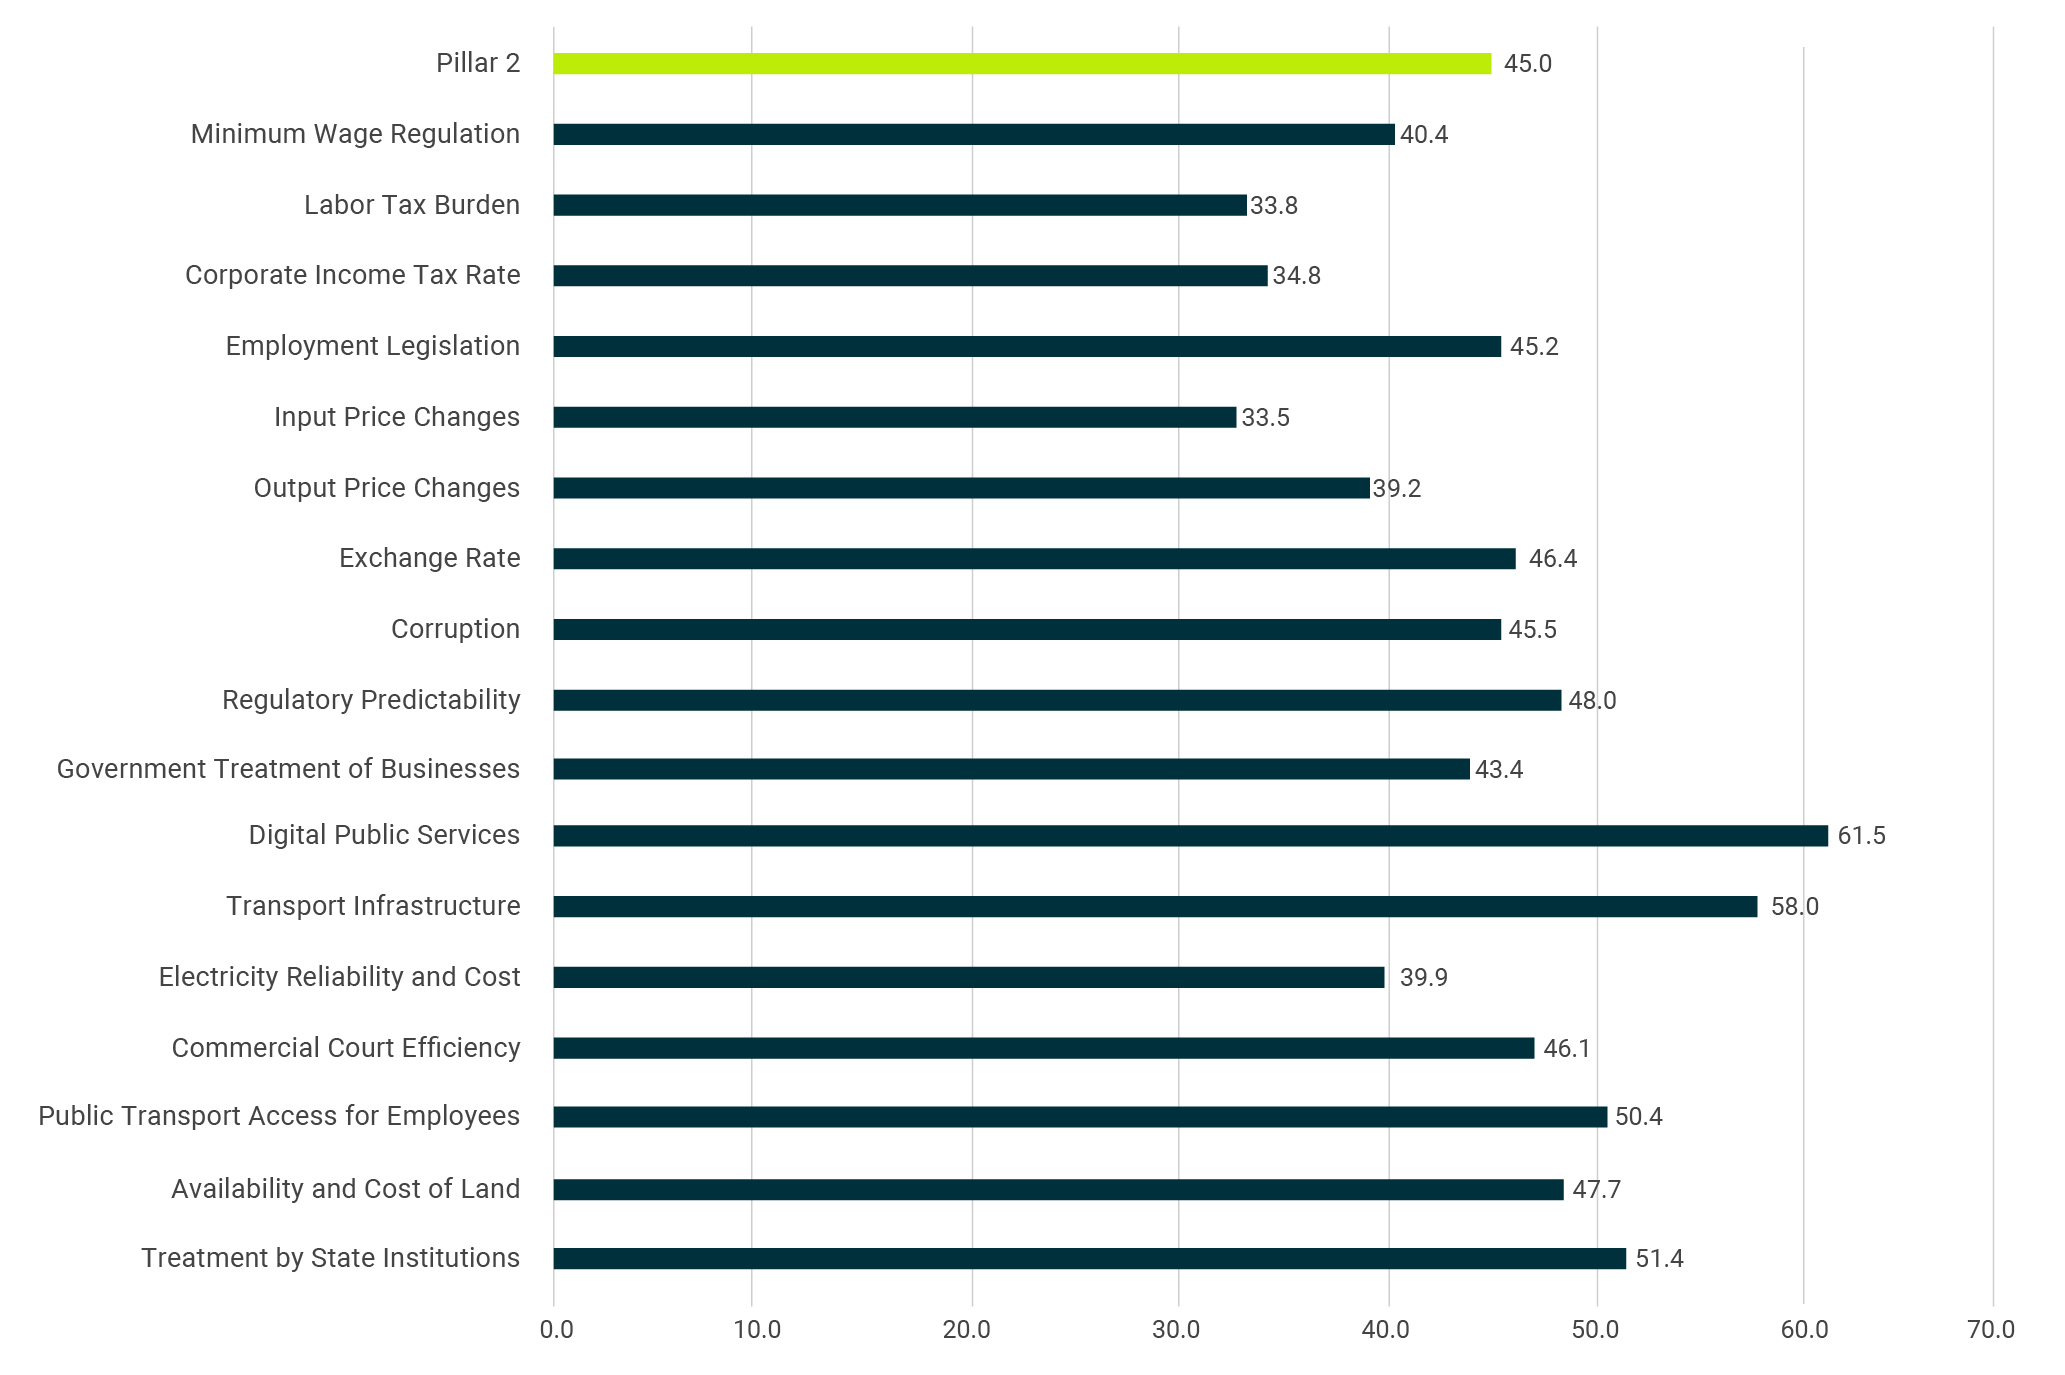
  • Companies hold a neutral or slightly negative attitude toward the business environment.
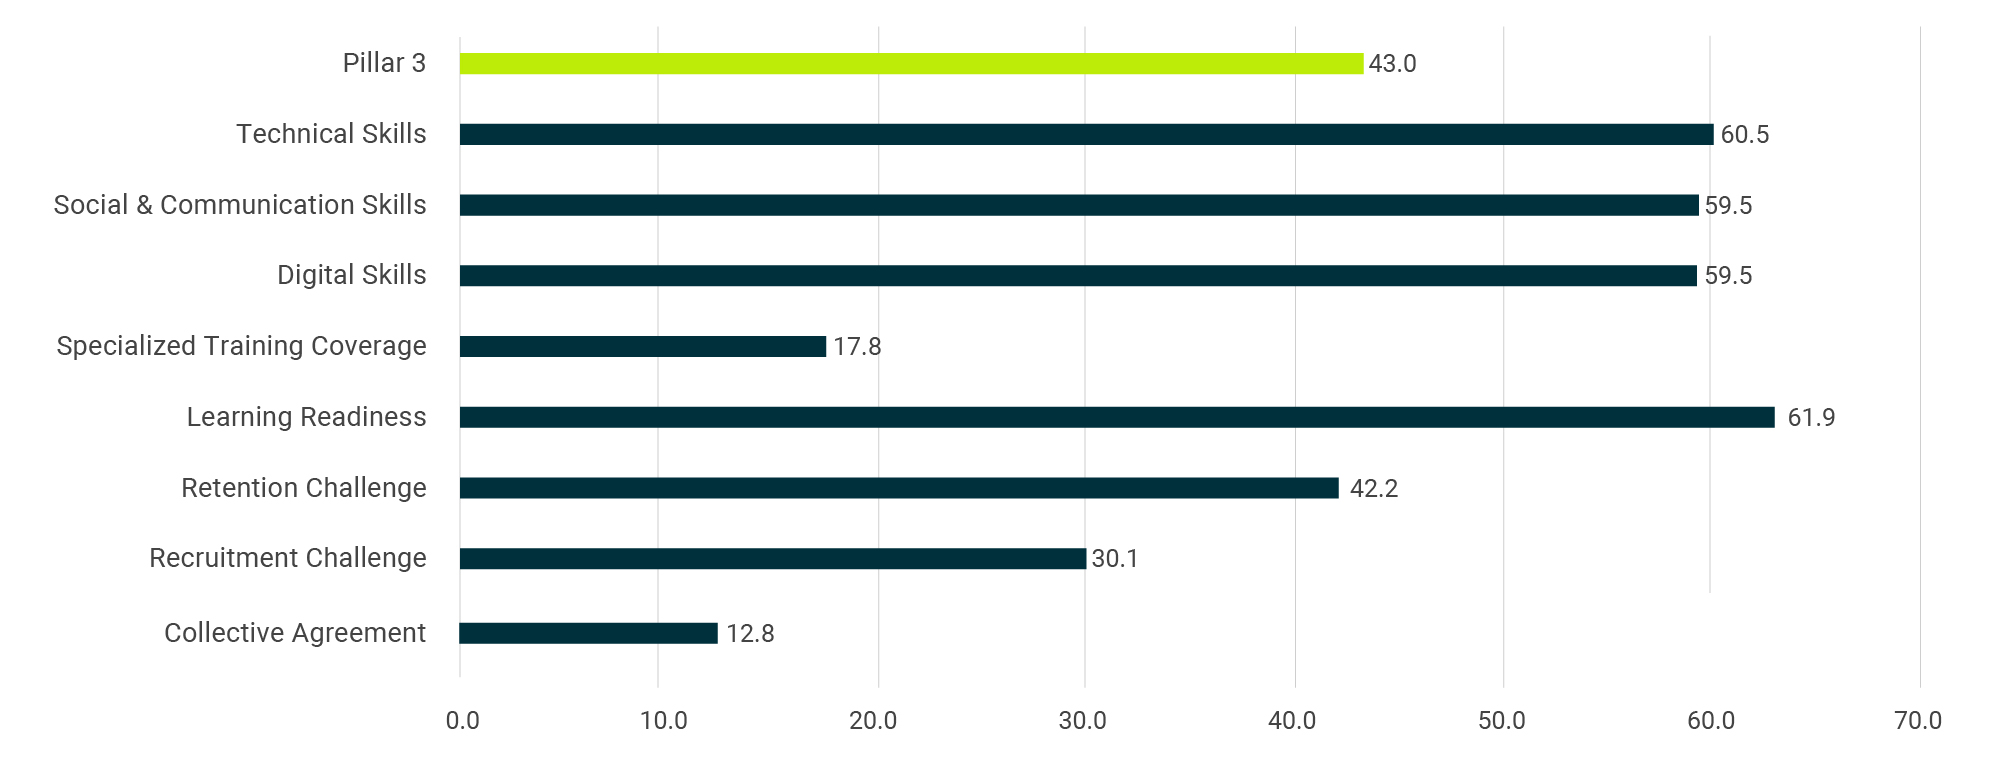
  • The key structural problem lies in the labor shortage affecting all sectors and regions of Serbia.
  • Serbia has a higher share of exporting companies compared to the EU, particularly in manufacturing. However, the average export intensity per company is weaker.
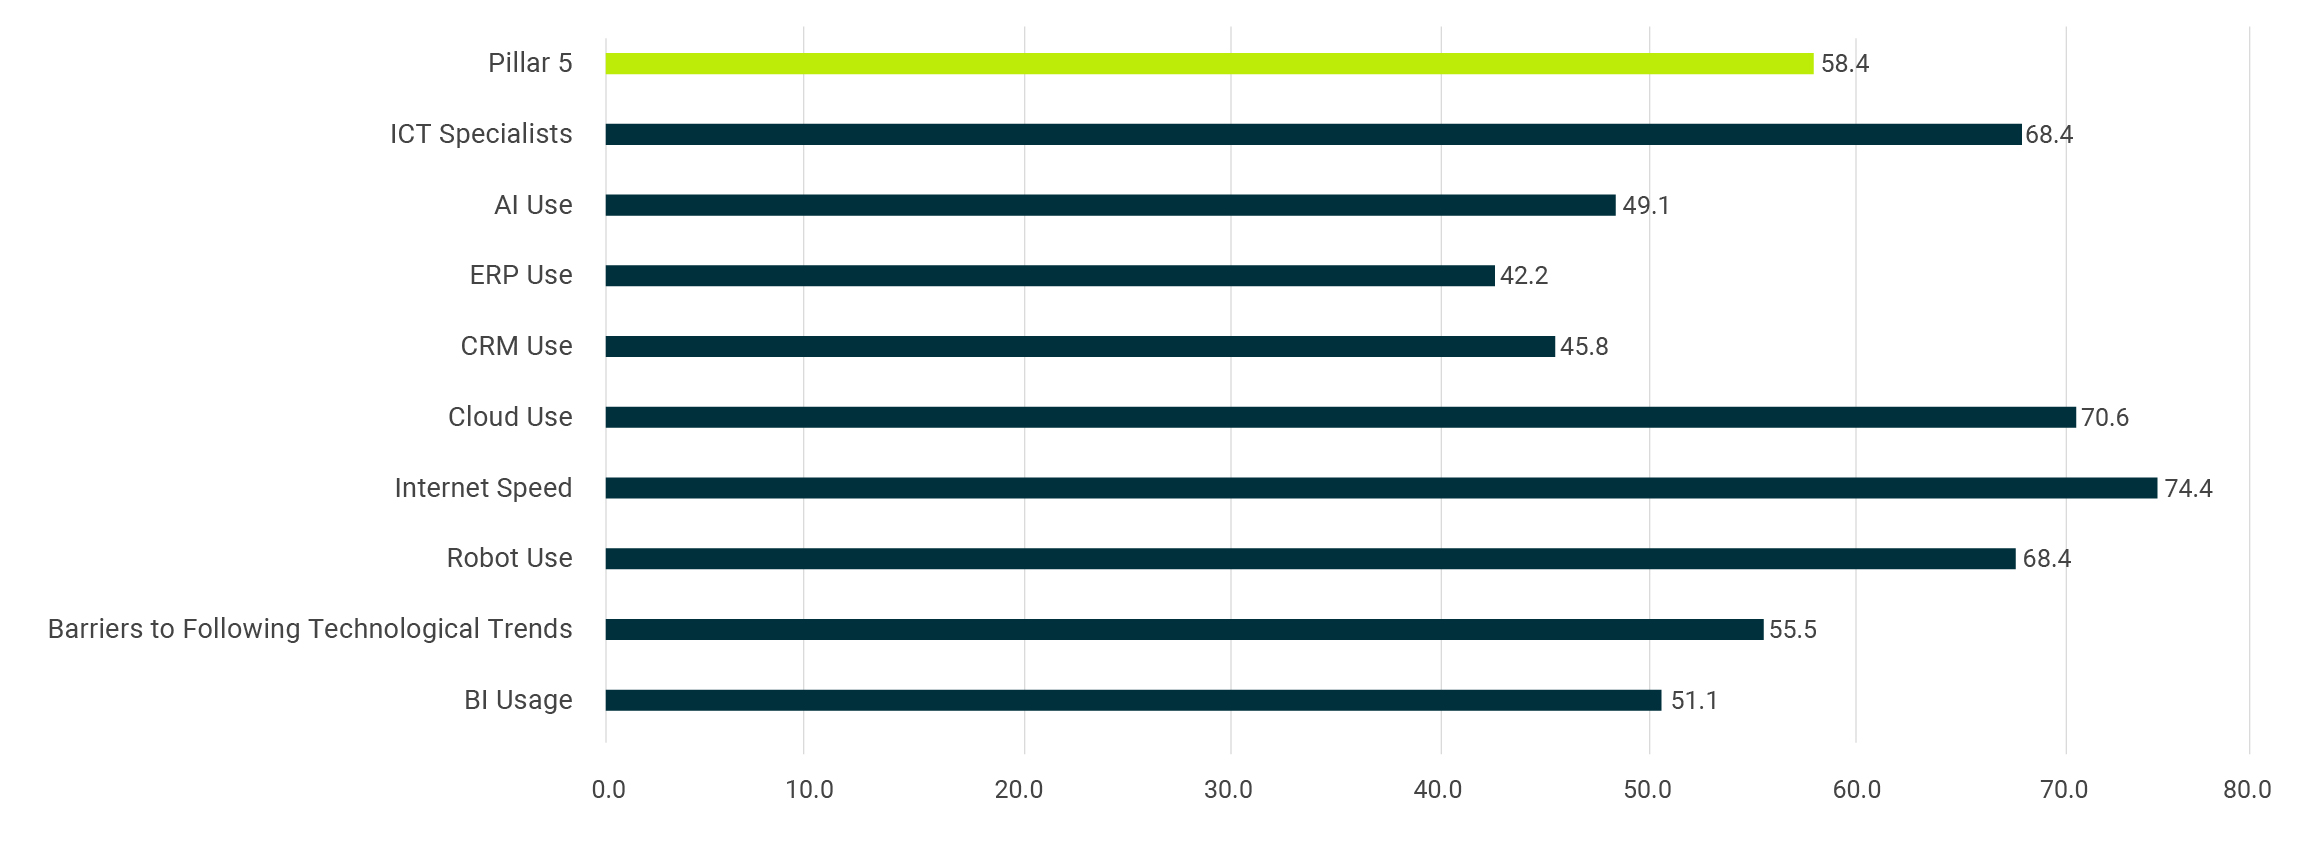
  • Insufficient investments: Serbian SMEs lack adequate investment in equipment, processes, technologies, and expansion, also they collaborate less, altogether resulting in subpar digitalization, innovation and green transformation.
  • Insufficient investments are not limited by the availability of external financing per se, as companies rarely use bank financing by choice.
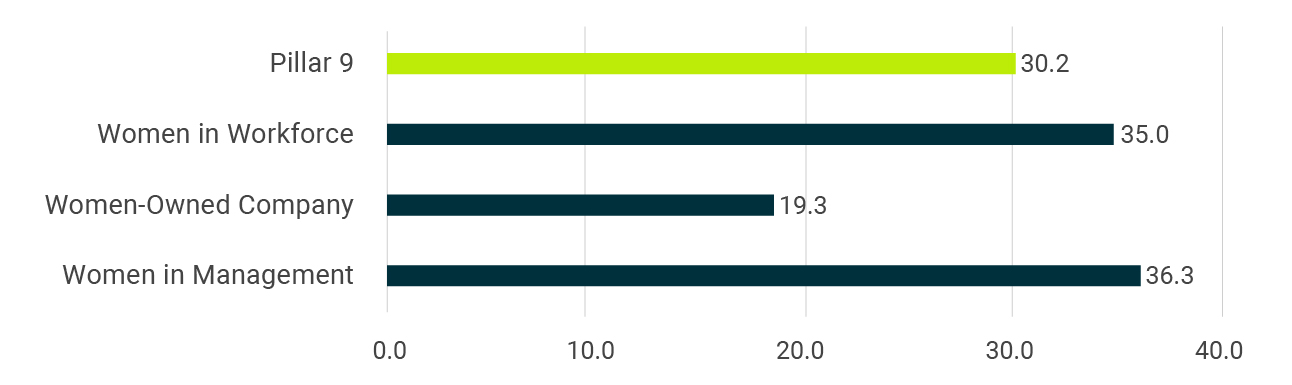
  • Gender equality: Women in the private sector face less favorable conditions, particularly in ownership, although their participation in employment and management positions is slightly better.

2. Constructing the SME Compass Index

The SME Compass Index (CI) is a composite index aimed at assessing overall competitiveness of Serbian SME sector. Within CI the competitiveness is assessed across different areas (pillars). In this chapter we provide a theoretical background on composite indices, and present main characteristics of CI, including its purpose, use, pillars, interpretation of results and methodology.

CI is a composite index that can be used to monitor the key determinants of competitiveness and development of SMEs in Serbia. Like any composite index, it summarizes a large amount of information in one indicator, but the results of all components can also be explored and unpacked back to the original question.

The results of the CI can inform interested parties about the fields in which our SMEs are catching up to or lagging behind the world trends. Information from this index can be used to direct policies, development projects, initiatives, as well as monitor the success of the implementation of national strategic documents. Especially convenient is the fact that all information is available on the interactive web portal as well, which contains all the necessary information on one place. In total it combines 75 indicators, which can be observed across 11 sectors (industries)[1], across different company sizes[2] and across 25 administrative districts of Serbia.

[1] Agri-food, low-tech, medium tech, high-tech, construction, trade, transport, HORECA, ICT, professional services and personal services
[2] 0-20 employees, 20-50, 50-250, 250-500 and 500+ employees.

Bearing in mind the shortcomings of all previous indices and the need for one comprehensive measure of competitiveness and innovation of the Serbian economy, the values of which can be monitored and compared by district and region, the Competitiveness and Development Index (CI) was created. This index is designed as a tool for finding and monitoring drivers of SME competitiveness in Serbia. It is designed as a composite index composed of nine pillars: (1) Business sentiment and performance, (2) Business environment, (3) Human Resources, (4) Business model, (5) Digitalization and industry 4.0, (6) Innovation, (7) Green transformation, (8) Access to finance and (9) Gender equality.[1]

[1] For the full list of indicators see the Annex 1.
Pillars Observed aspects
The SME Compass Index Business sentiment Sentiment about the previous and following year, business performance
Business environment Policy and regulation; macroeconomic conditions; infrastructure
Human Resources Workforce quality and availability; trainings
Business model Export orientation; communication with customers; business processes
Industry 4.0 Internet connection, speed and safety; web site; ERP & CRM; IoT, Robotics
Innovation IPR; new products and services; R&D investments
Green transformation Regulation; green investments; obstacles
Access to finance Use of external sources; diversification of financing instruments
Gender equality Women employment, ownership and management
[1] For the full list of indicators see the Annex 1.

3. Brief Methodology

The Competitiveness and Development Index (CI) represents a weighted average of nine pillars, each representing a weighted average of several indicators. The indicators are derived from hard data taken from the Serbian Business Registers Agency (2021 and 2022 financial statements), the data collected in other surveys conducted by the Statistical Office of the Republic of Serbia, such as the ICT usage survey (years 2021 and 2022) and Community Innovation Survey (CIS, 2020), and the data collected via specifically designed questionnaire for this study (CI Survey 2023) (see the table below for sample sizes). Please refer to the list of indicators presents the description of each indicator along with its minimum and maximum values, the weights within the pillar, and the weights within the CI (the source from which the indicator is derived is presented next to each indicator)

Source Sample size (number of companies)
Serbian Business Registers Agency (2021 and 2022 financial statements) 26.880
Community Innovation Survey 2020 3.709
ICT usage survey 2022 and 2021 1.573
CI Survey 2023 1.473

The computation is based on successive aggregations of scores from the indicator level (the most disaggregated level) all the way up to the overall CI score. Since the indicators are measured on different scales, it was necessary to standardize the data and ensure that each indicator’s minimum value is zero while the maximum value is 100. These standardized scores are combined to produce aggregated scores. In that way, the value of each pillar and the CI can range from zero to 100. That was accomplished using the min-max transformation according to the following formula:

where valuei,c is the value of an indicator i for a company c; lowi is the threshold value, which corresponds to the lowest value in the sample of companies covered; and highi corresponds to the highest value in the sample. In the case of “flipped” indicators where a higher value corresponds to a worse outcome (e.g., challenge to retain existing or attract new employees), the standardized score becomes 100 – scorei,c so that 100 always corresponds to the ideal outcome. With this approach, the score has a straightforward interpretation: it informs how close a region or a sector is to the set frontier (the higher the score, the closer the district or the industry is to the frontier) and, over time, it can show whether it is moving away from or closer to this frontier.

To determine the structure of each pillar, a principal component analysis (PCA) with orthogonal rotation (varimax) was performed on standardized indicators. The Kaiser-Meyer-Olkin measure verified good sampling adequacy for the analysis (KMO>0.8), and Bartlett’s Test of Sphericity (p<0.001) indicated that correlations between variables were sufficiently large for PCA. Eigenvalues were calculated for each component in the data, and 19 components had eigenvalues over Kaiser’s criterion of one, meaning that 19 factors were extracted. In the next step, the indicators that loaded into the same factor were analyzed, and based on the content of each factor, the 19 extracted factors were aggregated into nine pillars. Cronbach’s Alphas for all 19 factors are above the threshold of 0.7, meaning that measuring items have high reliability.

This index has several limitations. Firstly, most of the indicators are derived from survey data whose accuracy depends on the subjective judgment of the respondents. Second, due to the limited sample size, the results for some regions might need to be more representative and could be influenced by a small number of surveyed companies in those regions. For example, only five companies are in the sample from the Toplička region and 12 from the Pirotska region. On the other hand, 503 surveyed companies are from the Beogradska region. Therefore, the data may not fully capture some regions’ competitiveness and level of development. Finally, some indicators within the CI may not be equally relevant for all sectors. For example, green transformation is not significant for ICT or the professional services sector. Therefore, lower values for the Green transformation pillar are expected for those two sectors.

4. Interpretation of results

Index results are presented on a scale from 0 to 100:

In the case of phenomena that can have both a positive and a negative side, a value of 50 represents a neutral attitude, 0 a maximum negative, and 100 a maximum positive result.

For phenomena that show the presence or absence of something (technology, program, innovation), a value of 0 indicates the complete absence of the phenomenon/advance, a value of 50 a small amount of progress, and a value of 100 a large amount of progress/presence. In all cases except Business environment, Business model, Access to finance and Gender, maximum values are determined to resemble the EU averages, using proximate indicators.

In case of gender equality, we opted for the positive gender discrimination, meaning that the value of 100 would mean business economy completely owned / managed and employed by women. In current case, value of 50 shows presents equality.

In other words, Theoretical maximum of 100 would imply the perfect score across CI’s nine pillars, i.e. private sector that is (1) very optimistic and has solid economic performance (on the EU average level), unconstrained by (2) business environment, (3) workforce availability, (8) access to finance; constantly developing (4) it’s business model, (5) industry 4.0 and digitalization and (6) innovation (both to the EU average level); making constant improvements in (7) green transformation; and is (9) gender equitable.

5. Overall Competitiveness Analysis

The SME Compass Index for Serbia for 2023 stands at 40.1/100 which means that the private sector of Serbia is currently at the mid-low level of competitiveness and development.

Sentiment and performance are the area in which Serbian SMEs score the highest (see the graph below) – driven by the overwhelmingly positive sentiment (especially given the geopolitical and economic circumstances), and especially over the longer run. Business model and Human resources rank similarly, but they each show some weaknesses. In case of human capital, workers in Serbia are often praised, however, labor shortage is more than a serious constraint. In case of the business model, export orientation of companies in Serbia is a very good sign of competitiveness, however, companies make only limited efforts to make some tangible management or production improvements. These require new investments –which Serbian SMEs fail to make to a sufficient degree – and that translates to innovation, green transformation and digitalization and industry 4.0 where the SMEs score poorly in CI (see the graph below).[1]

[1] Detailed results over each pillar are available in Pillar analysis section.

Figure 1: CI results by pillars

When it comes to different sectors, higher value-added ones outscore lower value-added ones (see the graph below). Top 3 most competitive and developed sectors in Serbia are ICT (48.5), mid-tech manufacturing (47.8) and high-tech manufacturing (47.2). These sectors are in the lead when it comes to economic performance and sentiment, business model development, and application of modern technologies and innovation. ICT and high-tech manufacturing are less than others constrained by the labor shortage and are more gender equitable. At the same time, medium-tech shines in business model and green transformation. Sectors at the bottom mostly share the difficulties of those at the top, however, they lag more significantly when it comes to business model, digitalization, innovation and green transformation.

Figure 2: CI results by sectors

Key Takeaways:

  • Serbian companies have positive a mildly positive economic sentiment about the future (58.6/100 for the 2023), especially on the longer run (71.6). Accordingly, companies will dominantly retain the same number of employees (58%), or slightly increase it (34%). They have a solid EBITA margin (9%) and the debt-to-equity ratio (1.2) is not troubling.
  • Companies generally assume a neutral or only slightly negative attitude towards the business environment (45.0/100). In 2022 they were mostly constrained by high inflation (27.1) and express highest dissatisfaction with income and labor tax rates (around 37 each). On the other hand, business owners predominantly see their local communities as a good place of life for their employees (53.6) and praise infrastructure (52.9) somewhat more than the other aspects.
  • The key structural problem is the labor shortage, present in all sectors and throughout the territory of Serbia; the problem is particularly pronounced in sectors where lower paid jobs prevail and outside big cities. It is almost equally difficult for companies to retain existing employees (27.9) and to find new ones (24.5). On the other hand, the aspects of assessing the quality of workers and their willingness to learn and the absence of absenteeism are at a relatively high level (scores near 70). Also, 90% of companies claimed that they had been conducting competence improving trainings, almost half of which to a large extent. However, evidence from expert and company interviews CEVES has conducted throughout 2022 implies that companies’ HR practices would benefit from various technical improvements.
  • Share of exporting companies in Serbia (18%) is twice as high as in the EU, especially in manufacturing (49.5%) – in this regard Serbia is most similar to Serbia are Slovenia, Latvia and Estonia. The three most export-oriented sectors are ICT (59%), medium-tech (55%) and low-tech (50%). However, export orientation in total shows that although many companies export, average export intensity is small – meaning that Serbian companies manage to sell abroad, but in smaller quantities.
  • SMEs in Serbia do not invest enough – in new equipment, processes, capacities, machines, and technologies – and that is one of the primary reasons why they lag in digitalization, innovation and expansion of operations. Especially physical investments in production capacities are rare (22.0), as exemplified by the macroeconomic data as well (domestic Serbian SMEs invest two times less than their EU counterparts). Insufficient external sources of funding is one o the primary reasons, but not because companies get constantly rejected, but because they simply do not use it.
  • The use of somewhat simpler digital solutions such as ERP and CRM in Serbia (6.3% of companies) is three times lower than in all EU countries (19.5%), in the case of robotics and 3D printers twice as much (8.6%) against 16.8%), while the use of big data, AI and IoT is on average five times less frequent.
  • Innovation, acquisition and use of new technologies and green transformation, in addition to significant financial resources, also require technical and legal knowledge, as well as mutual cooperation between companies – which companies for the most part lack all together. In all these areas, and especially in cooperation, management of intellectual property and preparation of companies for the application of regulations in the field of environmental protection, there is large room for improvement.
  • In the area of environmental protection, a slightly more significant step forward was only in the area of reducing waste through recycling (37.5), reducing wastewater emissions / GHG (25.0), and increasing energy efficiency (22.7). The transition to renewable energy sources takes place to a very low extent (17.0), while the use of electric vehicles is very rare. The fact that the investments projected for the next period are even weaker than in the previous one is not encouraging. Within this pillar, low and medium-tech manufacturing and to some extent agri-food stand out in particular.
  • As much as 50% of companies do not rely on bank financing at all. Some 28% of companies access external sources of finance with difficulty, of which 8p.p. with great difficulty.
  • The position of women is significantly less favorable than men (gender equality index value 31.9), mostly in terms of ownership (23.0), while women’s participation in employment and presence in management positions are slightly better (42.0 and 39.6, respectively).

5.1 Business Sentiment

Business sentiment background

Business sentiment and past performance play crucial roles in determining the competitiveness of SMEs in the future. Their significance lies in shaping the decision-making processes of SMEs, influencing investment choices, and determining the overall openness of companies to new ventures.

Business sentiment reflects the collective confidence and optimism of SME owners and managers regarding future economic conditions, market demand, and profitability. Moreover, it often serves as a barometer of entrepreneurial expectations. Positive business sentiment encourages SMEs to undertake expansionary activities, such as increasing production capacity, investing in innovation, and exploring new markets thus fostering competitiveness by enabling SMEs to seize growth opportunities. Conversely, negative sentiment can hinder SME competitiveness by discouraging investments and causing businesses to adopt a more cautious approach. This may lead to missed opportunities for growth and development.

In similar fashion, strong past performance enhances SME competitiveness by instilling confidence in owners and business partners (most notably customers and lenders, as private investors are still not particularly important source of external funding for Serbian SMEs). It demonstrates the SME’s capacity to meet expectations and deliver value, fostering trust and credibility.

The sentiment is measured through perception of business – about the business situation within the past 12 months, and expectations about the business situation, revenues and the number of employees for the following 12 months. Moreover, to evaluate the sentiment over the longer time horizon, we include a five-year business vision as well. While the idea of sentiment evaluation is based on the perception and “animal spirit” idea of J.M. Keynes, performance is measured through hard data from financial statements of companies. Performance measurements include inflation adjusted total sales growth, EBITDA margin[1], gross value added (GVA) per employee, average wage per employee, debt-to-equity ratio. The idea behind these indicators is straightforward. The first two indicators of company performance indicate company’s market performance and profitability, the next two serve as indicators of productivity and complexity, while the last shows the overall solvency (indebtedness). In all cases except debt-to-equity ratio, the higher is better.

Results

With an overall score of 55.7 this is the highest ranked pillar in 2023 CI. This value shows that the Serbian SMEs on average have had the business year which is, although just somewhat above stagnation, relatively solid result given the global economic developments. The score is mostly driven positive by the 5-year development vision (71.6), while the sentiment about the next 12 months (58.6) is above the evaluation about the past (51,7) as well. In other words, companies in Serbia gauge their business development as relatively stable in the near future (slightly better than the past) and are optimistic over the medium term. The financial performance of the SMEs shows relatively high EBITDA margin for the economy (68,5) which translates to around 10%, while Debt-to-equity (68.2) shows acceptable levels of indebtedness (1.2). Sales growth also stands relatively close to “neutral” 50 (56.3), signaling that the real growth of sales was modest (evaluated at 5%, and even so, probably somewhat overvalued). It is to some extent odd that the companies are not as optimistic about revenues, given their opinion on the business situation. Regarding the productivity (GVA per employee) and average wages, companies in Serbia still trail considerably behind the EU business economy averages (scoring 33.1 and 33.6 points respectively). Finally, expected changes in employment are predominantly neutral (55.9 index points), i.e., 58% companies expect to retain current number of employees, 34% expect slight increase, while 7% expect slight decrease (large employment expansions or shrinking are not expected by a significant number of companies).

Figure 3: Business sentiment by indicators

These results are fully in line with the available macroeconomic indicators, as burdened with geopolitical tensions and high inflation, the global economy went into a slowdown. Serbia is no exception in that regard, and GDP growth in Serbia in 2022 stood at around 2,2% (SORS flash estimate). Average productivity of 24.000 EUR (companies with at least 5 employees) is still far below European 52.000 EUR, while wages, even price level adjusted, still trail around 40%.

Again, these results show relatively high resiliency of Serbian companies, demonstrated during the covid-crisis and illustrated by positive expectations even in conditions of possible economic downturns. However, as it is going to be highlighted thought this report on several occasions, positive expectations and solid performance do not translate to new investments to a sufficient degree, and along with shrinking labour force and potential treat of recession in Europe, could contain SME growth in the future to high degree.

Policy recommendations

Despite the global uncertainties and increasingly tighter monetary policy in Serbia (and the rest of the world), companies in Serbia have managed to keep a relatively decent sentiment and keep employment outlook steady. Last year’s performance is probably overvalued when it comes to sales due to high inflation (as nominal values were adjusted for consumer inflation). Although there are no alarming signs, several things should be considered:

  • Low productivity of the economy leads to low wages, which ultimately lead to emigration and enhances that circular relationship. It is evident that policy measures are necessary both horizontally and often vertically, designed for a specific industry. In that sense, overhaul of the subsidy system so far benefited mostly the large FDI companies and implementation of new instruments would be necessary to further spark the economy. Also, utilization of Smart specialization strategy to the full extent would be beneficial, particularly to the targeted sectors, but also to the economy at large.

Indebtedness of companies is not high on average and NPLs do not seem to be on the rise, yet those have to be closely monitored, especially in the construction which is cooling visibly down after several years of expansion (similar stands for the real-estate market).

5.2 Business Environment

Business environment background

The business environment refers to the set of external conditions and factors that influence the operations and performance of businesses on the national level. It encompasses various aspects such as legal and regulatory frameworks, taxation policies, labor laws, infrastructure, corruption levels, market conditions, and more. It plays an important role in creating conditions for increasing the competitiveness of the business sector. A favorable business environment enables a stable and predictable regulatory framework, ensures fair and efficient taxation systems, promotes transparency, and facilitates market access. When the business environment is favorable, companies are more likely to invest, innovate, and expand their operations. It encourages entrepreneurship, attracts foreign direct investment, promotes job creation, and stimulates economic growth. On the other hand, an unfavorable business environment can hinder the competitiveness of companies, leading to reduced investments, limited growth opportunities, higher costs, and lower productivity.

By assessing the current level of the business environment, policymakers can identify strengths and weaknesses in the business environment and implement targeted measures to enhance competitiveness. These measures usually include regulatory reforms, tax incentives, improvements in infrastructure, anti-corruption initiatives, streamlining administrative processes, and enhancing the overall ease of doing business. A favorable business environment can ultimately contribute to companies’ long-term competitiveness and sustainability, driving economic development and prosperity.

The pillar Business environment assesses the overall conditions and factors that influence the business climate in Serbia. It encompasses various indicators related to business regulations, taxation, labor laws, corruption, infrastructure, public services, and quality of life for employees. These indicators evaluate the impact of business environment factors on companies in Serbia, including minimum wage regulations, tax burden, profit tax rate, employment laws, inflation, exchange rate, corruption presence, and more. Additionally, the pillar measures satisfaction levels with aspects such as predictability of regulatory changes, communication with government institutions, digital public services, traffic infrastructure, reliability of electricity, the efficiency of commercial courts, availability of public transport, availability and price of building land, and the city or municipality as a place where employees can live a healthy and fulfilling life. By analyzing these indicators, the pillar aims to provide insights into the overall business environment in Serbia and identify areas that require attention and improvement to foster a more conducive environment for businesses.

Results

The overall score of the pillar Business Environment (45.0/100) shows that the business environment is above average compared to other pillars. Among the indicators, the highest performing factors include satisfaction with the assessment of the city/municipality as a place for employees to live a healthy and fulfilling life (53.6), satisfaction with communication with government institutions regarding company needs (53.4), and satisfaction with traffic infrastructure (52.9). On the other hand, the inflation rate (27.1) is the highest concern for companies in 2023. Areas that need improvement are the tax burden on wages (36.8) and the profit tax rate (36.7), which suggest a relatively high tax burden for businesses. Corruption presence (42.6) also remains a concern. According to the survey, 48% of surveyed enterprises believe the influence of tax burden on salaries is very or largely limiting, while only 4% believe it is very encouraging. Enhancing these areas, along with improving the predictability of regulatory changes, expanding digital public services, and maintaining satisfactory infrastructure, should contribute to a more favorable business environment in Serbia.

Figure 4: Business environment by Indicators

The World Intellectual Property Organization (WIPO) tracks the performance of innovation ecosystems using the Global Innovation Index (GII), which consists of two sub-indices and seven pillars. The first pillar, called Institutions, consists of three sub-pillars: Political environment, Regulatory environment, and Business environment. Among 132 countries ranked in 2022, Serbia assumed 43rd place in the regulatory environment with an index value of 72.3 out of 100 and 62nd place in the business environment with an index value of 49.0/100. This result is comparable with the result of our Business environment pillar, which assesses various aspects of the business environment, including regulations, among other things.

Policy recommendations

The following policy initiatives are proposed based on the results of the indicators under this pillar:

  • The Government should continue investing in digital public services while providing additional support to businesses for digital literacy and adoption. This support can include organizing workshops, training programs, and awareness campaigns to educate businesses about the benefits of digitalization and how to effectively utilize digital tools and platforms.
  • Infrastructure projects addressing gaps and improving transportation networks and broadband access should be prioritized. By focusing on these areas, the government will enhance the overall connectivity and accessibility for businesses across different regions. Investing in road networks and railways can further facilitate the efficient movement of goods and services, reducing transportation costs and improving supply chain logistics.
  • Consultations with the private sector should be conducted during the formulation of regulations. This collaborative approach ensures that regulations are practical, and consider the specific needs and challenges faced by different industries.
  • Anti-corruption measures and enforcement should be strengthened, and transparency in business transactions with government institutions improved. Tackling corruption and enhancing transparency are complex tasks that involve systemic changes, and comprehensive reforms. While this process may take time, a continuous and dedicated approach is essential to gradually improve the business environment in Serbia.
  • Evaluation of the profit tax rate for potential reduction and revising tax burdens on wages are recommended to create a more competitive tax structure. While implementing these changes may pose challenges, the long-term benefits of creating a tax environment that promotes business growth, innovation, and competitiveness make it a worthwhile endeavor.

5.3 Human Resources

Human resources background

Human resources are of utmost importance for SMEs to remain competitive in today’s business landscape. Having skilled and educated workforce available, developing it and utilizing its full potential is one of the key ingredients of retaining competitive advantage. Workforce availability is on one hand tied with country’s economic, educational and labor market policies, but on the other hand, by implementing effective HR policies and procedures, companies can mitigate workforce risks. In other words, by investing in training and development programs, SMEs can improve employee skills, knowledge, and abilities, enabling them to adapt to changing market conditions and contribute effectively to organizational success. In other words, effective human resource management facilitates SMEs in attracting and retaining top talent. Furthermore, employee engagement is very important as well, as Engaged employees prove to be more committed, motivated, and innovative, which positively impacts productivity and overall performance. SMEs that foster a culture of open communication, collaboration, and employee empowerment create an environment where individuals can contribute their best ideas and talents, leading to enhanced competitiveness in the market.

Through indicators of this pillar, we are assessing key aspects of human resources for companies – workforce quality, availability and employer-employee relations. Quality is assessed thoroughly several questions regarding different skills employers require out of their employees – technical, soft and digital. Workforce availability is assessed through questions about how difficult it is for employers to find new employees, and to some extent how difficult it is to keep the existing ones. The latter question is also related to employer-employee relations. It would be ideal if conclusions about these relations could have been drawn using two-sided approach including both groups, however, here we do it indirectly. Namely, companies with better employee-employer relations implement more training, evaluate willingness of their employees to acquire new skills higher, and for them it is less challenging to keep their employees. Of course, indicators regarding the skills of the recently employed workforce, alike challenge to attract new employees, are more relatable to the outside factors (from the perspective of the company), while the rest are mostly internal, and depend on companies’ HR practices.

Results

With the overall value of 47.3, human resources are the second highest-rated pillars within the CI. However, it results from two entirely opposite trends. First, the overall quality of the workforce in Serbia has been often praised – by the SMEs and large (FDI) companies alike, and that show in the results as well (figure below). However, Serbia at the same time suffers from a serious labor shortage, as challenge to retain and challenge to find new employees are one of the lowest-rated indicators within the CI – retaining employees is challenging to a large extent for 57% of companies (for 59% finding the new ones). The presence of trainings within company, even if a bit overestimated (49% companies express that they have implemented workforce trainings to a large degree), confirms that the labor market pressures companies into developing their own workforce. However, even if results generally show good relations between companies and employees and relatively high presence of trainings, SME HR practices in Serbia are not as developed as they could be, and are probably at the lower end of the business model practices spectrum.

Figure 5: Human resources by indicators

The quality of the workforce is praised for several reasons. In manufacturing and similar industries, worker skills come from Serbia’s engineering tradition (socialist legacy) and from good quality high education (especially in ICT related sciences). In services (particularly professional services) good knowledge of English language is often cited as one of the Serbia’s workforce strengths, while digital skills of the population are on pair with some more developed European countries (according to the WEF GCI). However, the extent to which the overall education system can be praised for the quality of the workforce remains a mystery, as no major curricula overhaul has taken place during the several past decades. Moreover, vertical mismatch (overqualification – 25% employees with higher education work on jobs that do not require higher education) and horizontal mismatch (difference between the studied field and the job at which somebody is employed – 42.4% of employees between 15 and 34 with a minimum secondary education work in professions not requiring education in the field in which they obtained it) signal that there are issues both regarding enrolment quotas and connections between education and businesses.[1]

Still, as much as the quality is praised, the quantity (or lack thereof) is a well-documented issue. According to National employment agency data[2], the percentage of companies facing difficulties in finding new employees was 37% in 2019[3]. This survey indicated that almost all industries had difficulties in finding new employees. On the side of specific profiles, the most deficient were service and craft occupations (as much as 46% of the total number of missing occupations) – locksmiths, welders and flame cutters, waiters, cooks, retailers, carpenters, masons, carpenters, textile tailors, bakers, plumbers, electricians and electrical installers in buildings, car mechanics, armorers, operators of metal processing machines (metal turners, metal grinders, etc.), butchers, as well as drivers (12%). Of course, Serbia also lacks almost all types of more sophisticated labor, however, their share in the total is somewhat smaller – and that is solely due to the fact that the number of companies that need these occupations is smaller compared to the rest of the economy. In other words, a large number of companies in most economic activities face a significant labor shortage.

However, aforementioned labor shortages could be found to some extent puzzling. As many as 28.3% of working-age residents (age 15-64 years) are not looking for employment (1.2 million people), while the 9.3% are still unemployed (287.4 thousand people). Comparatively speaking, according to the level of the activity rate and the employment rate, Serbia is still significantly behind the average of the European Union – the activity rate is lower by 4, and the employment rate by as much as 6 percentage points. Although the most improvement was recorded in terms of the unemployment rate, in 2021 it is almost twice as high as the average of the EU 27 (6.6%) and the new EU member states (4%). In other words, companies in Serbia are eager to employ, there are still significant quantities of potentially employable people, yet still the employment rate is low and unemployment high. The problem of emigration (around 10,000 people annually), mostly to Western Europe, has become to some extent mitigated by work immigration from the third-world countries – especially present in construction and agriculture.

Resolution to the puzzle rests on two main facts. First are the aforementioned mismatches – the profiles of the unemployed do not match the needs of the employers. Second is the fact that many of the unemployed (45.3% are unemployed for at least a year) and inactive have been either unemployed or out of the labor market for a while, causing their human capital to erode, thus lowering their employability. In other words, many of the unemployed do not possess skills needed on the labor market or have been out of the labor market for a while. In any case, both groups would require reskill/upskill training, along with motivation and soft skills training for the second group. These types of trainings are indeed conducted by the National employment agency of Serbia and some donor programs (most notably E2E by SDC), however their coverage (3,500-4000 people per year, combined) is insufficient relative to the both sides’ needs. As evident that the upscale of these efforts would be beneficial, it could be that Serbia would require a training of new trainers, as these programs already function at full capacity. Still, Serbia it is striking that Serbia does not have a coherent job vacancy monitoring, as it has yet to implement the Job vacancy survey which is regularly (quarterly) conducted in all European counties, which would help streamline the labor market, education and immigration policies.

Policy recommendations

As the problem of human resources goes both ways, so do the recommendations. The first set is aimed towards the enterprises themselves and to potential donor programs, as there is a concern that the enterprises do not have sufficient capacities or knowledge on how the existing issues can be resolved. These recommendations include:

  • Enhancing recruitment strategies: Establishing a strong employer brand by promoting positive attributes and values of your company. Moreover, collaboration with educational institutions or vocational training centers can be mutually beneficial.
  • Manage and update skill needs: regularly review skill needs, define job roles, responsibilities and qualifications for the existing employees, and in the same fashion define the new skill/employee needs.
  • Focus on employee development and retention: offer training to your employees regularly, according to the projected skill needs, as this would provide them with a career path as well, and then implement performance management systems (alike KPIs). Practices like that establish a supportive working environment, assigning mentors and teambuilding activities prove to be particularly impactful.
  • Encourage employee involvement: Seek input from employees on decision-making, process improvements, and organizational initiatives. Also, implement employee feedback mechanisms: Conduct regular surveys or focus groups to gather feedback and address any concerns or suggestions.
  • Finally, leverage technology: Implement HR information system (HRIS) which could help a company track the aforementioned activities.

As labor availability is a to some extent an issue that can be only addressed by the state policies, following recommendations are directed towards the Government of Serbia[4]:

  • Improvement concerning a better insight into the future labour demand could be realized by implementing the Job Vacancy Survey, an instrument that tracks employers’ needs across different industries and occupations.
  • The focus of the active labor market policies in the coming period could be shifted towards finding ways to re-activate the long-term unemployed and inactive population. In that sense, several measures would need to be bundled like motivation-activation training for unskilled and low-skilled persons, self-efficiency training and training at the request of an employer and training for the labour market.
  • Reskilling and upskilling programs would have to be increased in scope. The current capacities of 3,000 to 4,000 persons per year are insufficient (as indicated by full utilization). However, it is a possibility that Serbia would have to implement a “training of trainers” program, and significantly increase reskilling and upskilling capacities.
  • Due to the shrinking of the labour force affecting the reduced average employability of the registered unemployed population, efforts need to be intensified to increase the visibility of NES to persons who are not registered and take the necessary steps to register these people with NES.
[1] For a detailed overview of the Serbian labor market see: The analysis of the labour market and labour force needs in the context of migration governance (2022)
[2] http://www1.nsz.gov.rs/live/digitalAssets/14/14362_anketa_poslodavaca_2019__godine.pdf
[3] More recent reports are not publicly available. Results from the CI survey indicate that in 2023 the share of companies facing serious difficulties in finding labor force could be almost two times larger in comparison to 2019.
[4] More detailed list of recommendations is available at The analysis of the labour market and labour force needs in the context of migration governance, p.p. 95-97

5.4 Business Model

Business model background

The business model is one of the key pillars of competitiveness because it shows the extent to which companies in Serbia realize and maintain their competitive advantage. It is of particular importance in conditions when traditional ways to increase productivity based on the use of domestic natural resources and cheap labor have already been used. For companies to remain competitive, they need to use sophisticated production processes and constantly innovate. This pillar shows whether companies base their competitive advantage on low costs and cheap labor or on producing differentiated products and services that provide a higher degree of added value to their customers than the competition. Specifically, the pillar evaluates the extent to which companies utilize e-commerce and website, consider customer suggestions when developing new products or services, and whether they generate their income only on the domestic market or also on the foreign market. In addition, this pillar evaluates the company’s activities necessary to achieve a sustainable competitive advantage, such as the constant introduction of products or services that are new to the market, increasing the complexity and added value of existing products, constant improvement of business processes, increasing production capacities and the efficiency in the use of materials, energy and employees, conquering new markets, improving distribution channels and introducing new sales and marketing methods.

The pillar Business model focuses on assessing the strength and effectiveness of business models adopted by companies. It consists of 12 indicators that assess various aspects of a company’s business model. It measures various aspects related to the business model’s adaptability, innovation, and value creation. The indicators within this pillar evaluate elements such as e-commerce and website utilization, customer engagement and feedback, percentage of income generated on foreign markets, product line improvement, value-added enhancement, process automation, production capacity, resource efficiency, market expansion, distribution channels, and marketing strategies. By analyzing these indicators, the pillar aims to provide insights into how well companies are leveraging their business models to drive growth, competitiveness, and customer satisfaction.

Results

The pillar Business model has a final index value of 46.2, indicating above-the-average performance compared to other pillars under the index. The indicator with the highest value is website utilization (71.0), which points out that most Serbian companies have and use websites. The indicator with the second highest value is “Taking into account customer suggestions”, with a score of 68.6. This confirms that Serbian companies demonstrate a customer-centric approach and a willingness to adapt their products, services, and operations based on customer needs and preferences. They recognize the importance of understanding their customers’ expectations and value the role of customer feedback in driving continuous improvement and customer satisfaction. The export orientation indicator is also very high (50.0), placing Serbia among the most export-oriented countries in Europe. The export orientation of Serbian companies is also very high according to the official statistics – 18% of Serbian companies export (compared to around 8% of European), especially in manufacturing (49.5% vs. around 24% in the EU). However, export intensity (share of exports in revenues) in Serbia (20%) is smaller than in the EU, which brings the score to the 50.0.

Among the lowest indicators in the pillar, Serbian companies demonstrate room for improvement in three key areas: production capacities (22.0), distribution channels (35.2), and introducing new marketing methods (38.4). Serbian businesses need to improve their ability to increase production capacities, improve their channels for reaching customers and delivering products efficiently, and introduce innovative marketing techniques for effectively promoting their products or services. Improving these areas is key to improving the business model of companies.

Figure 6: Business model by Indicators

Policy recommendations

The index results indicate that SMEs require more support in business model innovation compared to large enterprises. Recognizing this need, the Ministry of Economy has taken action to assist SMEs and entrepreneurs in developing their business models. The Development Agency of Serbia, along with accredited Regional Development Agencies, manages various programs aimed at supporting SMEs. These programs include initiatives such as the Company support program for entering the supply chains of multinational companies, as well as programs focused on attracting foreign investment in target sectors and facilitating equipment purchases for SMEs. Additionally, accredited regional development agencies offer a standardized range of services, including training, advisory support, mentoring, and tailored packages for young and women entrepreneurs.

To further improve the business model of Serbian companies, the following additional policy measures are recommended:

  • Since the low investments, and especially physical investments are one of the main issues, reintroducing the tax credit for reinvested earnings policy once again (such policy was in force in Serbia until 2014) would be very encouraging for SME investment decisions. Furthermore, deliberations about establishing SME Development bank would also be a welcomed sight.
  • Develop a dedicated program within existing support initiatives aimed at improving logistics and distribution networks for SMEs. This program should prioritize fostering collaborations between businesses and logistics service providers to enhance distribution capabilities, reduce costs, and optimize efficiency.
  • Initiate programs that provide comprehensive support to businesses in adopting innovative marketing methods and techniques. Emphasis should be placed on leveraging digital marketing channels, social media platforms, and data analytics to maximize marketing effectiveness and reach a wider audience.

5.5 Industry 4.0

Industry 4.0 background

Global trends require the business sector, both in the industrial and service sectors, to transform their operations and adapt to the new digital age. Companies that do not adapt to new digital technologies risk losing competitive position in the market by failing to respond to the changing demands of consumers. Some of the most important trends in the field of digitization include: the use of cloud software and services that allow them to access their data and applications from anywhere and reduce the cost of their IT infrastructure; using social platforms to interact with customers; automation of business processes; data analytics and the use of big data tools; e-commerce; use of artificial intelligence; cyber security, etc.

The potential to enter new markets, expand into existing ones, attract a larger client base, and provide new goods and services all make digitization a key pillar of competitiveness. These factors help businesses become more competitive. This can increase their ability to compete and help them do so more successfully in the modern digital economy. Digital transformation is especially important for traditional businesses, since it enables them to automate data input and inventory management, boost operational effectiveness, cut expenses, and boost productivity. Traditional businesses also have the chance to employ data analytics to create personalized goods and services. Thanks to access to real-time data and analytics, they are now able to make data-driven judgments that weren’t previously conceivable.

The pillar Digitalization and Industry 4.0 focuses on assessing the digital transformation and adoption of advanced technologies in companies. It considers various indicators such as internet speed, implementation of ICT security measures, employment of ICT experts, use of robots, ERP software, CRM software, cloud solutions, IoT solutions, and AI solutions. These indicators provide insights into the company’s level of digitalization, utilization of Industry 4.0 technologies, and readiness for technological integration. By evaluating these indicators, the pillar aims to gauge the company’s digital maturity, technological capabilities, and innovation potential in the context of Industry 4.0.

Results

The overall value of the pillar is 25.1/100, which is the lowest value among all the pillars in the index. This indicates that there is significant room for improvement in the digitalization and adoption of advanced technologies within companies. Enhancing internet speeds, implementing robust ICT security measures, attracting more ICT experts, increasing the use of robotics, ERP software, CRM software, cloud solutions, IoT solutions, and AI solutions are key areas for improvement to drive digital transformation and improve competitiveness of Serbian companies.

The analysis of the individual indicators reveals both positive and challenging aspects. Among the indications, the impact of digitalization on business has the greatest value (66.1). Internet speed has also a substantially higher index value (49.8/100), although there is room for improvement. Applying ICT security measures has a relatively high value as well (33.7), suggesting efforts done to protect against cyber threats. On the other hand, while the employment of ICT experts is necessary condition for increasing internal capacities and achieving further progress in the field of digitization and Industry 4.0, our survey showed that only 44% of companies in Serbia employ ICT experts. The use of AI solutions exhibits the lowest value (0.6/100), indicating limited adoption in companies, presenting a significant opportunity for leveraging the benefits of AI technologies. Similarly, the use of robots has a low value (3.0/100), showcasing potential for increased adoption to enhance automation and efficiency. These insights highlight the need for companies to further enhance their digitalization efforts, especially in areas like AI adoption and robotics, to fully embrace the opportunities presented by Industry 4.0 and drive digital transformation.

Figure 7: Digitalization and Industry 4.0 by Indicators

The low level of digitization in business can also be observed based on an international comparison. Comparative statistics show that, in terms of corporate digitization, Serbia lags much behind the European average. In Serbia, the adoption of software solutions like CRM systems for marketing analysis, specifically for analyzing client information, remains relatively low at 6.7%, which is significantly lower compared to the EU average of 19.5%. Furthermore, the proportion of enterprises with a very high digital intensity index is merely 2.9% in Serbia, while the European average stands at 4.8%. Although there is an increasing trend of businesses using social media platforms for professional purposes, with around 49% of businesses adopting this approach, Serbia still falls behind the EU27 average of 58.7%. These findings reaffirm the lower level of digital transformation and integration of advanced digital technologies within Serbian companies when compared internationally.

Policy recommendations

To accelerate its digital transformation journey in the business sector, the Government of Serbia should concentrate on bolstering supportive policies in the areas of policy framework, infrastructure, skills and collaboration. Considering the current situation, the following measures are recommended:

  • Develop and implement a comprehensive national digital transformation strategy in SMEs that outlines clear objectives, targets, and measures for digital transformation across different sectors. The strategy should include specific initiatives to support companies in adopting ICT technologies.
  • Establish programs to enhance digital literacy and provide training opportunities for traditional companies. The Center for Digital Transformation already offers 2 programs to help businesses with their digital transformation, and while these programs are well-designed, more funding is required to expand their reach to more businesses. Additionally, it is vital to provide resources and support for companies to access and implement digital tools and technologies such as CRM software, ERP systems, and cloud solutions. These programmes should offer guidance and assistance in selecting the right solutions for their specific needs.
  • Improve Digital Infrastructure. The Serbian government has already made investments in robust and high-speed digital infrastructure. This involves establishing the National Data Centre in Kragujevac and investing in broadband networks in rural and remote areas. It is anticipated that the building of the “Innovation District” facility within the National Data Centre in Kragujevac will enhance technological capabilities and foster a more favourable environment for increased investments in R&D. These investments are currently in progress and according to the plan will be completed by the end of 2025, and concrete effects are expected only in the years after that.
  • Encourage networking and cooperation between enterprises, research institutes, and governmental organizations to promote information exchange and creation of digital solutions. The Government should support establishing platforms that link businesses with ICT consultants, specialists, and service suppliers.

5.6 Innovation

Innovation background

Innovation is generally considered a key pillar of competitiveness both at the micro and macro level. It refers to the creation and application of new ideas, products, services or processes that offer unique value to customers or society at large. At the macroeconomic level, innovation is often seen as a key driver of economic growth. Countries and regions that make investments in R&D and promote an innovative culture typically have more robust economies and greater levels of productivity.

One of the primary forces behind company innovation is widespread technological growth, making it possible to create new and better goods and services. Opportunities for innovation across a variety of industries and sectors will grow more prevalent as technology continues to improve. On the side, innovation also fuels quick technical advancement. Technological development in a variety of sectors, including biotechnology, renewable energy, artificial intelligence, and others, is accelerated by the creation of new tools and creative ideas.

At the micro level, innovation is one of the most important factors in the competitive advantage of companies, allowing them to differentiate their products and services from those of their competitors. Cost reductions, improved production, and increased efficiency can all be a result of innovations. They can also develop new markets and commercial expansion chances, which can aid organizations in gaining an advantage over rivals.

The pillar Innovation focuses on the company’s innovation and intellectual property management. It includes 7 indicators that evaluate the company’s efforts in introducing new or improved processes, managing intellectual property rights (IPRs), cooperation on R&D and innovation activities, and the role of government policies in encouraging private sector innovation. It also examines the company’s investment in R&D, R&D employees and the importance of IPR management for the company.

Results

The final index value for the innovation pillar (28.2/100) reveals modest innovation performance among Serbian businesses. It has shown limited progress in driving innovation, with evident room for improvement in IPR management, cooperation on R&D, investment in research and development, and leveraging government policies for a more supportive innovation ecosystem. Although Serbian businesses have reported that IPR management is highly important for their companies (71.6/100), they are performing at a very low level when it comes to obtaining, licensing, and selling their own IPR licenses (0.7/100). This demonstrates a complete lack of IPR management. Serbian businesses have engaged in some level of cooperation on R&D or innovation activities (4.0/100), but there is a big room for further leveraging collaborations. The business sector also allocates a relatively low percentage of its income to R&D (20.4/100). On the other hand, the degree to which government policy promotes the growth of innovations in the private sector has been rated above the pillar average (45.3/100), despite the fact that the final value indicates that government policies only moderately promote innovation in the private sector and that more policy development is needed.

Figure 8: Innovation by indicators

Innovation in developed countries is often driven by private sector research and development, with significant investment from large corporations, universities and research institutions. On the other side, the index values revealed that low levels of IPR management and low R&D spending characterize Serbia’s business sector. In comparison to the benchmark set by the EU27 of 1.49% in 2021, Serbia’s business expenditures on R&D (BERD) as a percentage of GDP were only 0.45% for 2021. This shows that Serbian businesses have little interest in engaging in innovative and research-driven projects that result in the development of new products, processes, or technologies. The relatively low proportion of researchers from the business sector in Serbia (15.1%) compared to the average for the EU27 (60.16%) is one of the factors contributing to the very low degree of collaboration between Serbian enterprises and the academic sector in R&D or innovation activities. Another area where Serbia falls well behind other countries internationally is IPR management which has been found to be at a very poor level in Serbia. Patent applications to the European Patent Office per million inhabitants in Serbia are relatively low at 1.77, while the EU27 average is much higher at 151.1. This explains why there are fewer innovations and a lower level of patent activity in Serbia, as indicated by the results of our index.

Policy recommendations

Before proceeding with any recommendations, it is essential to emphasize that Serbia has already established a robust framework of support and implemented several significant initiatives to catalyze innovation and R&D endeavors within the business sector. These efforts encompass the establishment of vibrant innovation ecosystems through the development of startup hubs and science and technology parks, the creation of the Innovation Fund to provide support for business R&D and emerging enterprises, and the implementation of R&D tax exemptions, among various other measures. As a result of these measures, in 2021, the gross domestic expenditures on R&D (GERD) totaled more than 520 million euros, accounting for approximately 1% (0.99%) of GDP. While this represents an increase of 8.8 percentage points compared to the previous year, it still lags behind the 2020 average for the EU27, which stood at 2.31%. However, our index indicates that there is still room for improvement in the business sector, particularly in the areas of Intellectual Property Rights (IPR) management and R&D investments. Therefore, the following recommendations are suggested:

  • As a complementary to existing IP Box measure, enforcement mechanisms for intellectual property rights should be strengthened. Specific programs and services that assist businesses in managing their intellectual property assets effectively should be introduced. This can include providing IP advisory services, facilitating patent filing procedures, and offering legal support for IP protection and enforcement. As a result, businesses may be better able to navigate the patent system and realize the full potential of their discoveries.
  • Introducing public procurement policies that prioritize companies with patented technologies or innovative products. This should motivate companies to invest in R&D, obtain patents, and compete for government contracts, thereby promoting a culture of patenting.
  • Modify the policy on FDI subsidies. Introduce incentives and subsidies aimed at luring FDIs that establish R&D centers in Serbia rather than subsidizing businesses in Serbia that only perform low-value jobs. For businesses involved in R&D, this may entail providing tax advantages, financial grants, or reduced infrastructure and utility expenses. These incentives should be designed to attract and retain R&D-focused investments.
  • Enhance support for technology transfer and the commercialization of research outcomes. This should involve strengthening the existing and introducing new technology transfer offices and facilitating the connection between research institutions and businesses for the successful translation of research findings into commercially viable products or services.

5.7 Green Transformation

Green transformation background

One of the most medium to long term challenges for global economy is the need to shift towards green(er) business models. The ability of businesses to compete on international markets, where strict criteria for recycling, energy efficiency, waste management, and other areas are swiftly being imposed, is becoming more and more dependent on investments in green technologies. It may significantly affect a company’s ability to compete in several ways. It improves a company’s ability to attract environmentally conscious clients, foster brand loyalty, achieve long-term cost savings, ensure regulatory compliance, reduce the possibility of fines, legal troubles, and reputational harm, and create opportunities to enter new markets and expand the customer base.

The European Green Deal intends to cut pollution, make industry and transportation sustainable, achieve climate neutrality in Europe by 2050, and grow the economy through green technologies. Serbia has ratified an important international agreement for environmental protection, such as the 2030 Agenda for Sustainable Development, UN Framework Convention on Climate Change, the Convention on Biological Diversity, Carbon Border Adjustment Mechanism, the German Act on Corporate Due Diligence Obligations in Supply Chains, etc. However, Serbia is only slowly making headway toward fulfilling these international responsibilities, and the country is still in the early phases of its green transition. Therefore, participation in global supply and value chains is becoming increasingly burdened with the need for various green and social responsibility certificates, particularly for manufacturing companies.

At the national level, Serbia is only at the beginning of its green transition. First, Serbia’s electrical energy production dominantly comes from fossil fuels (70%), while renewables (outside of hydropower) stand at around 3% (IEA). Also, the electrical energy price in Serbia, both for households and commercial consumers is far below the EU averages (2-3 times, depending on the consumption band). In other words, energy in Serbia is at the same time relatively cheap and highly polluting, providing weak incentives for energy saving, energy transition (for the companies) and eventually undermining state’s capacity to make the transition itself. Second, waste management in Serbia is loosely organized and suffers from a major lack of public investments, which translates to business sector the same way it does for electricity. In other words, it is essential to make large investments in sewage treatment facilities, landfills, and water supply networks. Serbia has one of the lowest rates of municipal garbage recycling in Europe and one of the lowest levels of resource productivity. Most industrial plants in Serbia lack any kind of wastewater treatment infrastructure.

The pillar green transformation encompasses a set of indicators that evaluate a company’s progress and plans in embracing sustainable practices and minimizing its environmental impact. These indicators assess various aspects of the company’s environmental performance and commitment to environmental responsibility and sustainability in line with the broader goals of creating a more sustainable and greener future. The indicator 1 assesses a company’s familiarity with environmental regulations and expectations, reflecting the company’s knowledge and compliance with relevant environmental laws. The progress made by a company in reducing the emission of harmful gases and wastewater over the past three years is evaluated by indicators 2 through 6, indicating the company’s efforts to mitigate its environmental impact. The indicators 7 through 10 focus on a company’s plans for investments in emission reduction, waste reduction, renewable energy transition, and energy efficiency improvements and indicate the company’s intention to further enhance its environmental performance and commitment to sustainability. In all cases, the higher is better.

Results

According to the index value’s findings, Serbian enterprises’ green transformation represents one of their most vulnerable competitiveness pillars (25.8/100). While a company’s knowledge and familiarity with environmental regulations and laws is on the relatively high level (59.4/100) meaning that companies on average claim to be familiar with environmental regulations, its progress made over the past three years and intention to further enhance its environmental performance and commitment to sustainability are on the low level. A slightly more significant step forward was made only in the area of reducing waste through recycling (37.5), reducing the emission of harmful gases/waste water (25.0), and increasing energy efficiency (22.7). The transition to renewable energy sources occurs to a very low level (17.0), while the usage of electric vehicles is quite uncommon. It is not encouraging that the investments forecast for the following period will be much weaker than those for the previous one. Even 67% of businesses responded that they do not anticipate making any investments in renewable energy sources in the near future.

Figure 9: Green transformation by Indicators

The modest results of this pillar are not surprising considering that Serbia stands at the very back of Europe in terms of the emissions intensity of fine particulate matter (PM2.5) from the manufacturing sector. This indicator shows that in 2020, Serbia’s manufacturing industry’s PM2.5 emission intensity was 0.79 grams per euro (chain linked volumes), which is far higher than the EU27 average of 0.07. While many companies in Serbia are familiar with legal regulations and expectations when it comes to environmental protection, there are still many barriers standing in their way, including a lack of funding, a lack of knowledge and expertise regarding green technologies as well as insufficient regulatory support. While Serbia has made progress in creating the regulatory framework and establishing environmental regulations and laws, strategic policy implementation is still lacking. Unlike most EU member states which invest significant resources and efforts in this area, Serbia has not yet put any incentives in place to encourage the green transition, such as feed-in tariffs, tax credits, grants, or subsidies for businesses making investments in green transition.

Policy recommendations

The limited advancements observed in the past three years regarding the green transformation reflect a lack of awareness among the business sector in Serbia. To address this, the government should intensify efforts to enhance general awareness on this topic. Given its industry-specific nature, it is advisable to partner with industry associations and clusters to organize educational campaigns and workshops dedicated to sustainability and the advantages of adopting green practices in business operations. Additionally, collaboration with industry associations and trade organizations can facilitate the dissemination of information on green practices and the promotion of sustainability within specific sectors.

Despite being identified as a priority in the Industrial Strategy, the current situation shows that the Government of the Republic of Serbia does not allocate any financial resources towards promoting green investments in companies. To promote the adoption of environmentally friendly solutions, Serbia should provide support to businesses by encouraging innovation and R&D activities in areas such as clean technologies, waste management, renewable energy, and energy efficiency. It is crucial to allocate additional funding from the Innovation Fund and Science Fund towards R&D programs that specifically focus on green technologies and sustainable innovations.

Furthermore, Serbia should consider establishing financial mechanisms and incentives to encourage green investments by companies. For example, setting up a green investment fund, offering low-interest loans or loan guarantees for environmentally friendly enterprises, or providing tax advantages for eco-friendly investments. These initiatives should help alleviate financial barriers and foster more green investments in the business sector.

5.8 Access to Finance

Access to finance background

The ease with which businesses can obtain financial resources and services, such as loans, credit lines, venture capital, and other forms of funding, is referred to as access to finance. It is critical for a company’s competitiveness since it allows a company to fund operations and technology, expand commercial activities, and respond to market opportunities. Adequate access to finance encourages business growth and job creation by providing enterprises with the resources they need to invest, improve infrastructure, and increase productivity.

Access to Finance is an important pillar in the index since it underlines the importance of financial accessibility and affordability as fundamental drivers of company competitiveness.

The pillar Access to Finance consists of two indicators: “Access to external sources of financing” and “Diversity of external sources of financing”. The indicator “Access to external sources of financing” assesses how easy it is for businesses to access external financing, such as bank loans, venture capital, and other forms of funding. It assesses the availability of financial institutions, loan application process efficiency, borrowing costs, collateral requirements, etc. Higher values indicate better financing access, enabling companies to invest and innovate. The indicator “Diversity of external sources of financing” measures the extent to which companies seek funding from external sources rather than relying on internal funds or self-financing. The utilization of external financing options can have a significant impact on the competitiveness of companies. It provides them with the necessary capital to fuel their business activities and drive their competitiveness in the market. Relying solely on internal funds may limit the growth potential of companies, especially in situations where significant investments are required.

Results

The index’s total value for the pillar Access to Finance is 45.4/100. The indicator “Access to external sources of financing” has a value of 46.9, indicating a moderate level of access to external funding for companies. Diversifying financing sources can be advantageous for businesses since it offers them additional funding options, decreases reliance on a single source, and promotes financial flexibility. However, the indicator “Diversity of external sources of financing” has a value of 41.8, indicating that external sources of financing are used occasionally. In this context, it suggests that enterprises in Serbia use external finances but rely more on internal resources or self-financing.

Figure 10: Access to Finance by Indicators

One of the indicators that the Global Innovation Index (GII) uses is domestic credit to private sector (% of GDP). It refers to financial resources provided to the private sector by financial corporations, such as through loans, purchases of non-equity securities and trade credits and other accounts receivable, that establish a claim for repayment. According to that indicator, Serbia assumed 75th place among 132 countries ranked in 2022 by WIPO, with an index value of 45.5 out of 100, which is very similar to the result obtained in this study.

Policy recommendations

In Serbia, the availability and usage of non-traditional financing options beyond conventional bank credits are limited. Alternative funding sources like venture capital, private equity, angel investors, and crowdfunding platforms are not well-developed due to factors such as lack of awareness and a small number of investors specializing in these alternatives. Additionally, many companies lack the ability to present strong business plans and financial statements that meet lenders’ requirements. To tackle these challenges and encourage greater utilization of alternative financing and commercial bank credits by SMEs, the Serbian government should consider implementing various measures:

  • Government agencies, including national and regional development agencies should implement programs that promote financial literacy and education among entrepreneurs and small business owners. Provide training on financial management, investment strategies, and accessing funding options.
  • The government should take steps to ease credit access for SMEs. This involves implementing initiatives such as credit guarantee schemes to mitigate lenders’ risk and improve the availability of cost-effective credit choices.
  • Government should incentivize its support to the development of alternative financing mechanisms such as crowdfunding platforms, venture capital funds, and angel investor networks. It should promote collaboration between the public and private sectors to establish funds specifically targeted at supporting innovative startups and high-potential businesses.
  • Establish a national development bank to bridge the financing gap for development projects, particularly for small businesses and agriculture, where the current financial market falls short. Traditional financial institutions like banks face limitations in meeting the diverse needs of the economy, mainly due to regulatory frameworks and risk policies that are often unattainable for micro and small enterprises in the development stage, as well as small agricultural farms.
  • Implement mechanisms that enable the inclusion of private investment funds, venture capital funds, and individual investors in the co-financing of projects supported by the Innovation Fund of the Republic of Serbia.

5.9 Gender Equality

Indicator background

This pillar investigates the status of gender equality in the workforce to shed light on significant elements of underlying and emerging trends impacting gender parity trajectories. Many variables, including enduring structural impediments, socioeconomic and technical change, and economic shocks, influence and contribute to gender inequalities in the workforce. Although more women are entering the workforce and rising to leadership positions, cultural expectations, workplace regulations, the legal system, and the availability of childcare continue to impact the choices of educational paths and career trajectories significantly. The decade of austerity that followed the 2008 Global Financial Crisis constrained sectors that formed the backbone of the social infrastructure, affecting how families and primary caregivers (often women) performed during the pandemic. Moreover, women who continue to earn and amass wealth at lower levels will likely be impacted by the projected worsening of the current cost-of-living crisis.

The United Nations recognized gender equality as one of its 17 Sustainable Development Goals since it represents a fundamental human right and a foundation for a peaceful, prosperous, and sustainable world. Although there has been progress in recent decades, gender equality will not be achieved by 2030 as planned. The social and economic impact of the COVID-19 pandemic is exacerbating the situation. Progress has lagged, including time spent on unpaid care, household chores, and gender-responsive budgeting. Women’s health services are already underfunded and face significant disruption. Violence against women remains widespread. And while women are leading the way in responding to COVID-19, they still trail men in securing the decision-making positions they deserve.

The Gender equality pillar measures the share of women and men who occupy professional and management roles as well as women’s ownership in Serbian companies. It consists of three indicators: the percentage of female employees, the percentage of ownership held by women in the company, and the percentage of women among managers.

Results

The overall score for this pillar (34.9/100) is below average and lowers the overall CI score. Of the three indicators that make up this pillar, the proportion of female employees has the highest value at 42.0. The second-highest score of 39.6 is the proportion of women in management, which indicates that more than 50% of management positions in Serbian companies are still held by men, although there are a significant number of women in management positions. The indicator for the share of women among business owners has the lowest value (23.0). Although there are slightly more men than women in the workforce, most Serbian companies are owned by men and not women.

Figure 11: Gender Equality by Indicators

Based on Global Gender Gap Index, the World Economic Forum benchmarks the current state and evolution of gender parity across four key dimensions (Economic Participation and Opportunity, Educational Attainment, Health and Survival, and Political Empowerment). With an overall value of 0.779 out of 1, Serbia assumed 23rd place among 146 countries that the index benchmarked in 2022. Among Europe, Serbia took 15th place among 35 ranked countries. However, when Economic Participation and Opportunity is solely analyzed, Serbia assumed 77th place among 146 countries. This result is comparable with the result of our Gender equality pillar, which solely focuses on women’s workforce and not on the other three dimensions that the Global Gender Gap Index includes.

Policy recommendations

Serbia implemented a new Law on Gender Equality in May 2021, aligning it with EU standards. However, further commitment and decisive actions are required to expedite progress, particularly in promoting laws, policies, budgets, and institutions that support gender equality. Improvements have been less effective in areas such as enhancing economic empowerment for women, addressing the needs of vulnerable groups, and fostering gender-sensitive education. To address these challenges, several recommended measures have been suggested to enhance the current situation:

  • Support women entrepreneurs by providing targeted assistance to encourage business start-ups, thereby promoting economic empowerment, and increasing representation in leadership roles.
  • Introduce mandatory gender quotas for corporate boards and executive positions to break down barriers and ensure a minimum representation of women in decision-making positions.
  • Enforce legislation for equal pay and implement monitoring mechanisms to address gender-based pay discrimination.
  • Develop a comprehensive system for collecting gender-disaggregated data to track progress, regularly assess women’s representation in top-level positions, and evaluate the effectiveness of implemented policies.