

SME Compass Index 2024 evaluates the competitive dynamics across eleven individual sectors within Serbia’s economy. Each sector is determined based on a commonality of primary business activities, implying that businesses within the same sector largely share homogenous economic activities, technologies, and supply chain infrastructures. The index offers both a holistic competitiveness score for each sector and a more granulated breakdown at the pillar and indicator level. The subsequent dashboard offers a detailed exploration of each sector.
Sectoral Breakdown within the SME Compass Index:

Interpretation of Results
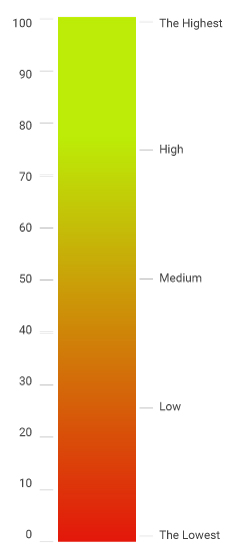
Scores are presented on a scale from 0 to 100.
In the case of phenomena that can have both a positive and a negative side, a value of 50 represents a neutral attitude, 0 a maximum negative, and 100 a maximum positive result.
For phenomena that show the presence or absence of something (technology, program, innovation), a value of 0 indicates the complete absence of the phenomenon/advance, a value of 50 a limited amount of progress, and a value of 100 a large amount of progress/presence.
In other words, theoretical maximum of 100 would imply sector’s perfect score across nine pillars, i.e. private sector that is (1) very optimistic and has solid economic performance (on the EU average level), unconstrained by (2) business environment, (3) workforce availability, (8) access to finance; constantly developing (4) it’s business model, (5) industry 4.0 and digitalization and (6) innovation (both to the EU average level); making constant improvements in (7) green transformation; and is (9) gender equitable.
In all cases except Business environment, Business model, Access to finance and Gender Equality, maximum values are determined to resemble the EU averages, using proximate indicators.
In case of gender equality, we opted for the positive gender discrimination, meaning that the value of 100 would mean business economy completely owned / managed and employed by women. In current case, value of 50 shows presents equality.
Brief Sectorial Insights
Sectors with higher value-added consistently outperform those with lower value-added. Notably, ICT, high-tech manufacturing, and mid-tech manufacturing emerge as the most competitive ones. These sectors lead in various aspects including economic performance, positive sentiment, strategic business model evolution, and the integration of modern technologies and innovations. Further, while ICT and high-tech manufacturing sectors experience less constraints from labour shortages and exhibit commendable achievements in gender equity, medium-tech manufacturing distinguishes itself with robust business model development and significant strides in green transformation. The sectors ranking lower struggle with a common set of challenges, most evident in their lag in business model innovation, digital transformation, and green transition.
Description of Sectors
1. Agri-food
Agriculture, food and beverages.
2. Low-tech
Textiles and clothes, wood products, paper, furniture and jewellery.
3. Medium-tech
General and special purpose machinery, rubber and plastics, metal products, electrical equipment and basic mineral products.
4. High-tech
Computers, communication equipment, electronic components and boards, optical products, medical instruments, chemicals.
5. Construction
Construction and adaptation of civil and on-civil projects, infrastructure and other utilities.
6. Trade
Wholesale and retail.
7. Transport
Passenger and freight transport.
8. HORECA (Hotel/Restaurant/Cafe)
Hotels, restaurants and cafes.
9. ICT (Information and Communication Technology):
Software development, telecommunication and other IT services.
10. Professional Services
Business consulting, legal services, workforce leasing, cleaning and other maintenance services.
11. Personal Services
Hairdressing, personal training, amusement parks and betting.